SurplusInterconnectionin Ohio
Accelerating Clean Energy Deployment by Leveraging Existing Grid Infrastructure
Ohio's clean energy transition faces critical interconnection bottlenecks despite significant grid infrastructure
The Problem
Data Center Demand Surge
Data centers and industrial expansion drive up to 15 GW of projected new load for AEP Ohio by 2030, with ~$30 billion in data center investment concentrated in the Columbus metro area. Combined with Intel's $20B fab and $59 billion in active industrial projects, extended interconnection timelines (5-7 years average) limit competitiveness for these high-value investments seeking speed-to-power.
Gridlock in Interconnection Queues
Ohio has ~65-70 GW of projects in PJM interconnection queue (AEP and ATSI zones combined), with average wait times of 5-7 years. PJM's total backlog exceeds 250 GW, and Ohio's MISO territory adds another 35-45 GW in Zone 6.
Skyrocketing Capacity Prices
Capacity market prices have surged dramatically: PJM Rest of Pool (covering Ohio's AEP and ATSI zones) hit $269.92/MW-day for 2025/26, and 2026/27 reached the price cap at $329.17/MW-day. MISO Zone 6 summer capacity prices spiked to $666.50/MW-day for 2025/26.
Gas Plant Supply Chain Constraints
New gas plants ordered today won't come online until 2030-2031 at earliest, with capital costs surging from $1,116-1,427/kW to over $2,000/kW for recent combined-cycle projects (GridLab, 2025).
The Solution: Surplus Interconnection
Surplus Interconnection for Ohio
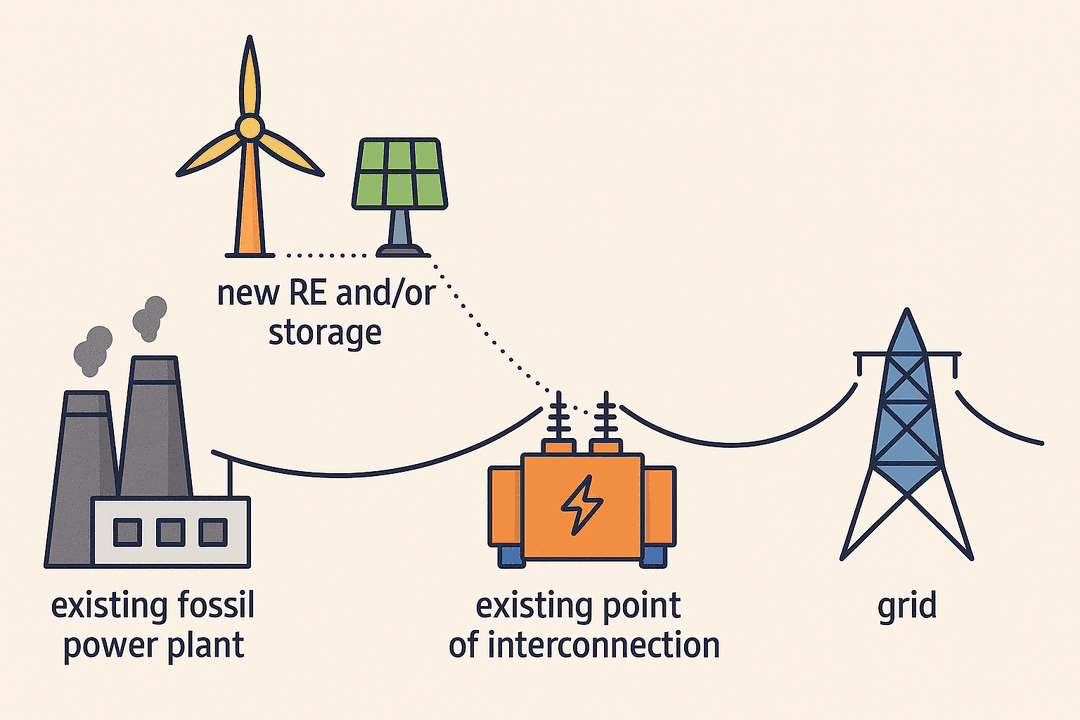
Surplus Interconnection Service allows new electricity supply resources to connect to the grid using existing infrastructure that serves already operating generators, without exceeding the total output capacity already allocated to the existing resource. FERC Order 845 (2018) cleared a regulatory pathway for generators to add new electricity resources to the grid by utilizing surplus capacity at existing interconnection points.
Key Results
Available Surplus Capacity
Ohio can add 30 GW of clean energy capacity through surplus interconnection: 19.3 GW solar + 6.5 GW wind + 4.2 GW storage. This includes 16.9 GW at thermal plants and 13.1 GW at existing renewable plants—all at existing sites without new transmission.
Cost Savings
Surplus interconnection can save $2.5 billion in interconnection costs by leveraging existing infrastructure, equivalent to $520 per Ohio household. This conservative estimate only accounts for interconnection savings—additional benefits from co-location and transmission utilization would increase total savings significantly.
Fast Deployment
Surplus interconnection projects can be completed in 12-18 months compared to 6+ years for standard queue projects. PJM and MISO's surplus processes follow streamlined study approaches, enabling rapid deployment when no network upgrades are triggered.
Thermal Interconnections
Ohio has significant thermal capacity, with plants operating at less than 15% capacity factor (mostly gas peakers), leaving grid connections idle most of the time. By 2030, building new solar will be cheaper than operating existing thermal plants. By co-locating solar and wind at these sites, we can bypass lengthy interconnection queues and deploy clean energy using existing infrastructure.
Key Results
Abundant Local Resources
~1,843 GW PotentialOver 1,843 GW of combined solar (1,646 GW) and wind (198 GW) potential exists within 6 miles of Ohio's thermal plants. This enormous renewable resource can enable clean energy deployment at existing interconnection points.
Underutilized Capacity
5.6 GW at <15% CF5.6 GW of Ohio's thermal capacity (21%) operates at less than 15% capacity factor, with 40% operating below 30% CF. This leaves expensive grid infrastructure idle most of the time, creating immediate opportunities for surplus interconnection.
Economic Crossover
26.3 GW by 2030By 2030, building new solar will be cheaper than operating 26.3 GW of Ohio's existing thermal plants (100% of total thermal capacity) with IRA tax credits. Without IRA, solar is cost-competitive with 7.6 GW (29%) of thermal capacity.
Total RE Integration Potential
~16.9 GW by 2030Approximately 16.9 GW of renewable energy (~15.0 GW solar + ~1.8 GW wind) can be economically integrated at Ohio thermal plants by 2030, using existing grid connections and avoiding lengthy queue delays.
Thermal Plant Portfolio
26.3 GW CapacityOhio has 151 thermal units across 47 plants with 26.3 GW total capacity. Gas CCGT dominates at 47% (12.4 GW), followed by Coal at 31% (8.0 GW), Gas CT at 21% (5.6 GW), and Oil & Gas Steamers at 1% (0.3 GW).
Renewable Interconnections
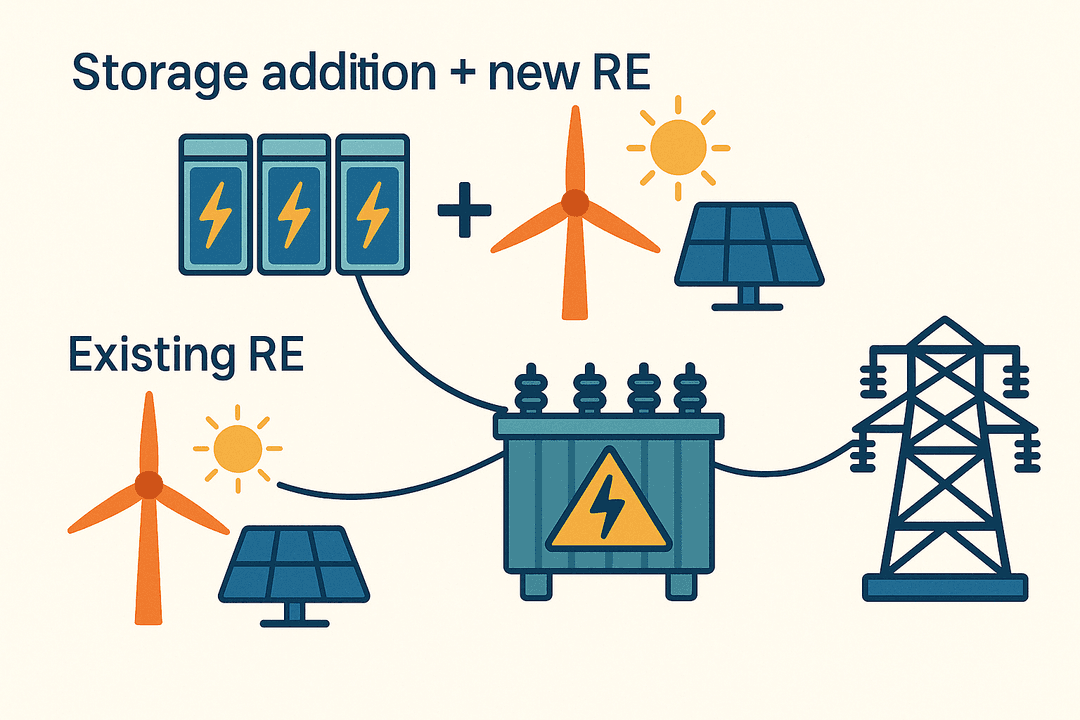
Ohio's existing renewable capacity operates at low capacity factors—meaning interconnection capacity sits idle most of the time. Adding battery storage can enable additional renewable capacity and dramatically increase capacity factors, effectively turning variable renewables into firm power resources.
Key Results
Renewable Resource Potential
~291.5 GW TotalOhio's existing renewable sites have approximately 291.5 GW of combined solar (260.3 GW) and wind (31.2 GW) resource potential within 6 miles of existing RE plants, representing enormous opportunity for expansion.
Battery Storage Integration
~4.2 GW of 6-Hour StorageAdding approximately 4.2 GW of 6-hour battery storage at Ohio's solar and wind sites would deliver firm, dispatchable capacity with 58% ELCC (PJM 6-hour storage)—comparable to Gas CT—helping meet peak demand and enhance grid reliability.
Additional RE Capacity
~8.9 GW EnabledOhio's existing renewable interconnections can support an additional ~8.9 GW of renewable capacity (~4.2 GW solar + ~4.7 GW wind) when paired with battery storage, with no new grid connections required.
Maximized Utilization
~81% Average CFDeploying storage and additional renewables at existing interconnections dramatically improves capacity factors from ~30% to approximately 81% on average. This transforms intermittent renewables into firm resources comparable to gas CCGT plants.